Introducing Question-Level Analysis (QLA)
Deep Insights into Class Performance Have Arrived At The CSUK:ReviseCS & CSUK:Academy Platforms
We’re thrilled to announce the launch of our brand-new Question-Level Analysis (QLA) feature — now available throughout your Curriculum Progress Tables, Task Analysis Tables, and within each Task Monitor popup - on both CSUK:ReviseCS and CSUK:Academy.
This powerful tool gives teachers an instant, data-driven picture of how well their students are performing on every individual question of an assessment or quiz.
It’s a huge leap forward in understanding where learning gaps exist and why they occur — all from within your existing dashboard.
🔍 Where to Find It
Wherever you see the QLA icon, you can click to open a detailed analysis of student performance.
This small chart icon appears beneath relevant assessment and quiz tables. With just one click, it unlocks a complete breakdown of performance, instantly visualising your class’s strengths and misconceptions.

📊 From Question to Question – Visualising Understanding
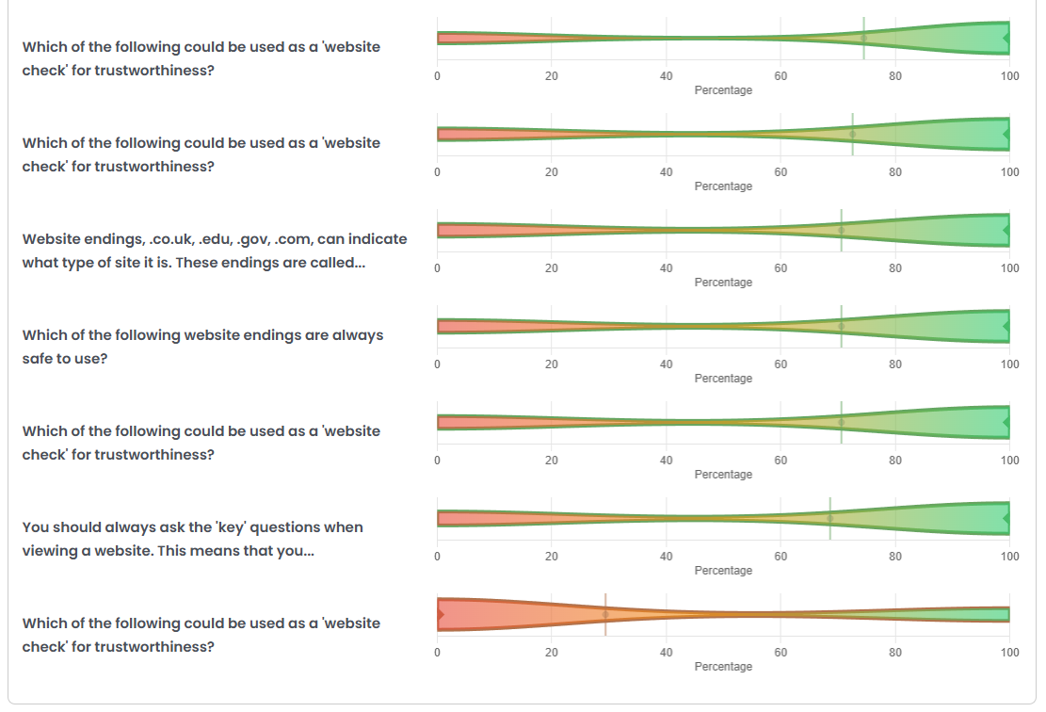
The first view you’ll see is the Question-Level Visual Analysis.
Each question from the assessment is listed in order from best-answered to most-challenging, accompanied by elegant violin charts that show how your students performed.
The violin chart represents the distribution of scores for that question:
-
The width of the shape shows how many students achieved scores within that range.
-
The narrower ends indicate fewer students scored there, while the wider sections reveal concentrations of students achieving similar results.
-
The green and red colour gradients reflect success and difficulty — instantly showing whether the question was confidently answered or widely misunderstood.
-
A marker line identifies the mean (average) performance, so you can quickly compare question difficulty at a glance.
This statistical approach allows teachers to move beyond total marks and see patterns of understanding — whether the question was consistently easy, unexpectedly difficult, or polarised between high and low achievers.

🧾 The Tabular Analysis – Precision Meets Clarity
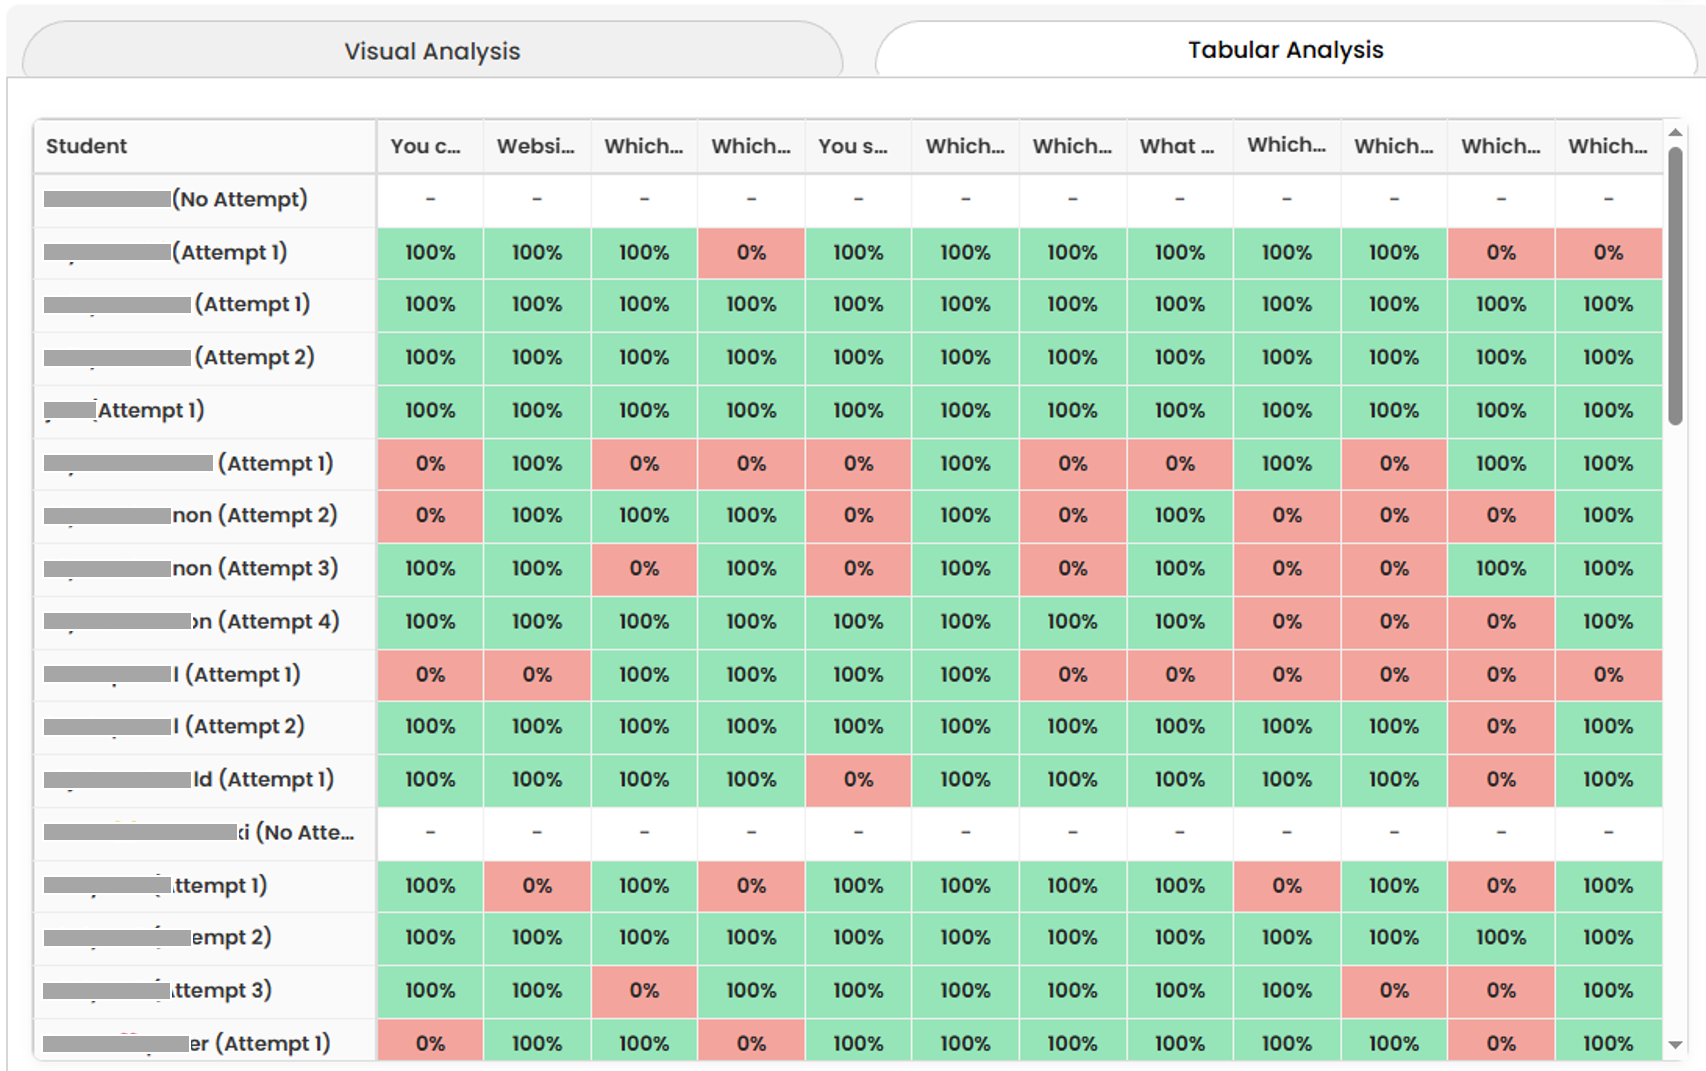
For teachers who prefer hard numbers, the Tabular Analysis view presents each student’s performance against every question.
Rows represent students, while columns show each question.
-
Green cells indicate correct or high-scoring answers.
-
Red cells highlight errors or misconceptions.
-
Hovering over or scrolling through the table makes it easy to pinpoint trends — perhaps a single concept that many students struggled with, or a high-performing student who missed a key question.
This matrix is also exportable, allowing you to download and share your analysis data for reporting or moderation.

🎯 Filter and Focus – Custom Views for Deeper Insight
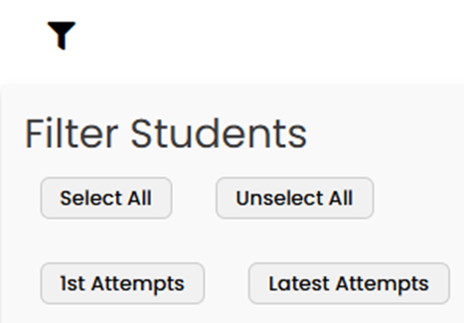
The Filter Students panel lets you tailor your analysis to the subset of data you care about most.
You can:
-
Select or unselect students to isolate specific groups.
-
View only first attempts to measure initial understanding.
-
Switch to latest attempts to track improvement and learning progression.
This dynamic filtering gives you full control — so whether you want to evaluate intervention impact, compare cohorts, or identify students needing extra support, you can do it instantly.

💡 Why Question-Level Analysis Matters
QLA isn’t just a nice-to-have feature — it’s a vital part of evidence-based teaching.
By examining performance question-by-question, teachers can:
-
Identify specific misconceptions shared by multiple learners.
-
Adjust future teaching plans to revisit weaker topics.
-
Celebrate mastery of well-understood areas.
-
Provide targeted feedback grounded in real data.
It brings clarity to assessment outcomes — transforming them from numbers on a page into actionable insights that drive student progress.
🚀 Try It Today
Log into either the CSUK:ReviseCS or CSUK:Academy platforms, head to your Task Analysis Table, Curriculum Progress Table or open any Task Monitor popup, look for the QLA icon, and start exploring the data behind your class’s performance.
With Question-Level Analysis, you’re not just marking results — you’re uncovering learning patterns, identifying misconceptions, and empowering students to grow.


